Tracesheet
- Ref
- U7
- Category
- software
- Status
- in development
- Year
- 2026
- Rev
- A
Multi-year company evaluation sheets built from annual-report figures, where every margin, return and multiple opens a trail back to the report, page and line it came from.
Tracesheet turns a company’s annual-report figures into a multi-year evaluation sheet, and every number on that sheet can be traced back to where it came from. Select a margin, a return on capital or a valuation multiple and it opens the trail: the filed lines it was computed from, each one naming the report, the printed page and the report’s own label for the line. It’s open source on GitHub under the AGPL.
It comes from a private investment-research project I’m working on with my dad. The private project holds the investing method, the part that judges a company. Tracesheet is the public core underneath it: the engine that reads the figures, checks them and computes from them, with no opinion of its own.
The sample sheet covers Kühne+Nagel from 2005 to 2025, built from 47 filings typed in from the company’s public annual reports. It’s one self-contained HTML file: open the Kühne+Nagel sheet and select any figure.
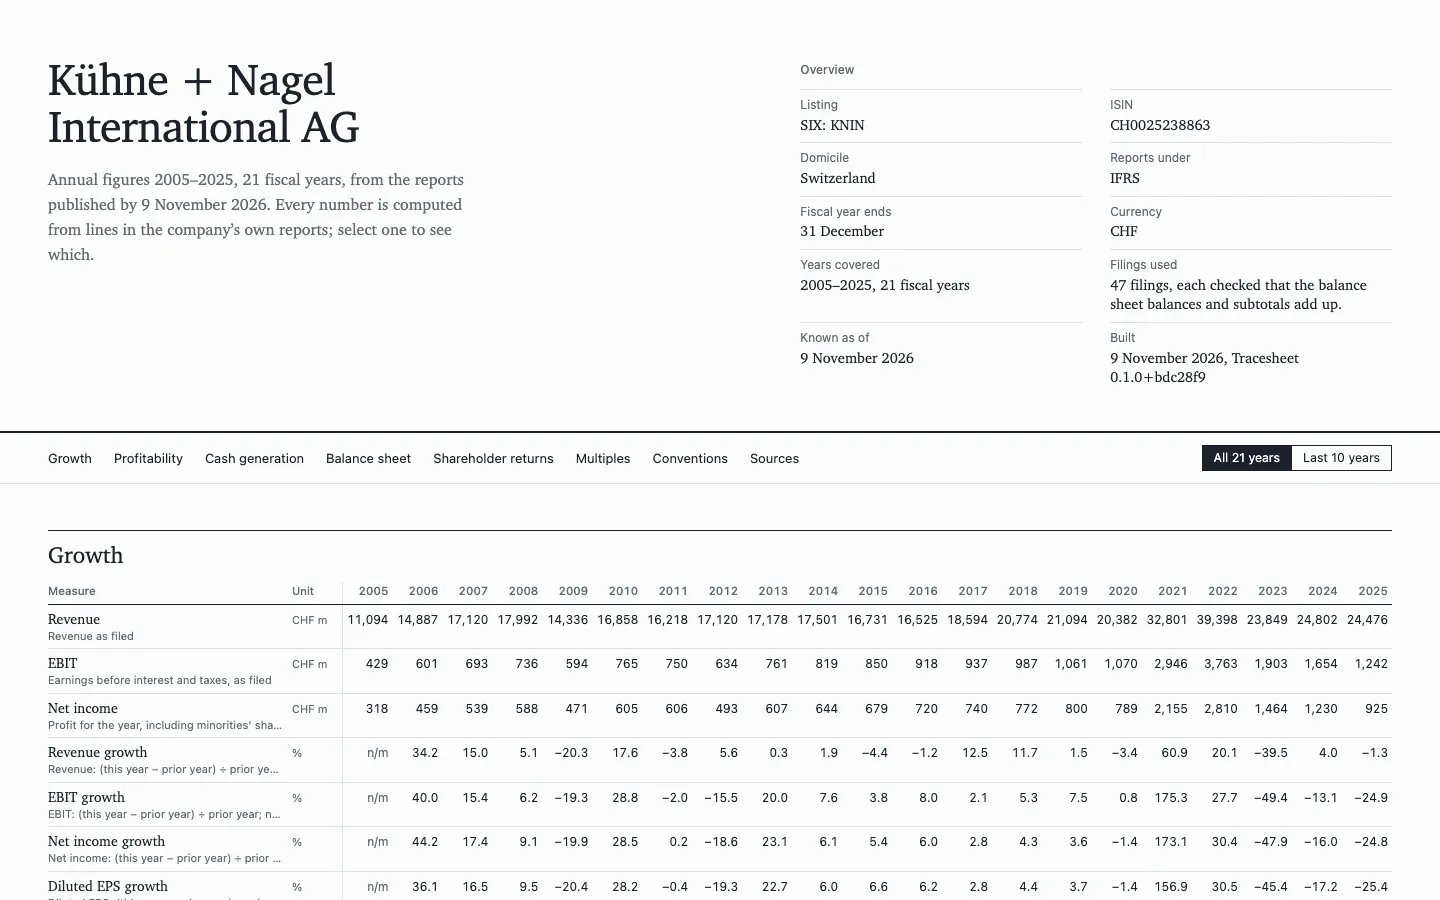
The top of the sample sheet: the overview, the section tabs, and 21 years of growth figures.
Why traceability
A spreadsheet of financial ratios is only as good as its least checkable cell. Figures get re-keyed by hand, restated numbers get mixed with original ones, the wrong share count ends up in a per-share figure, and the result looks exactly as confident as a correct one. Tracesheet makes the trail part of the number, so a figure you can’t check simply can’t be built.
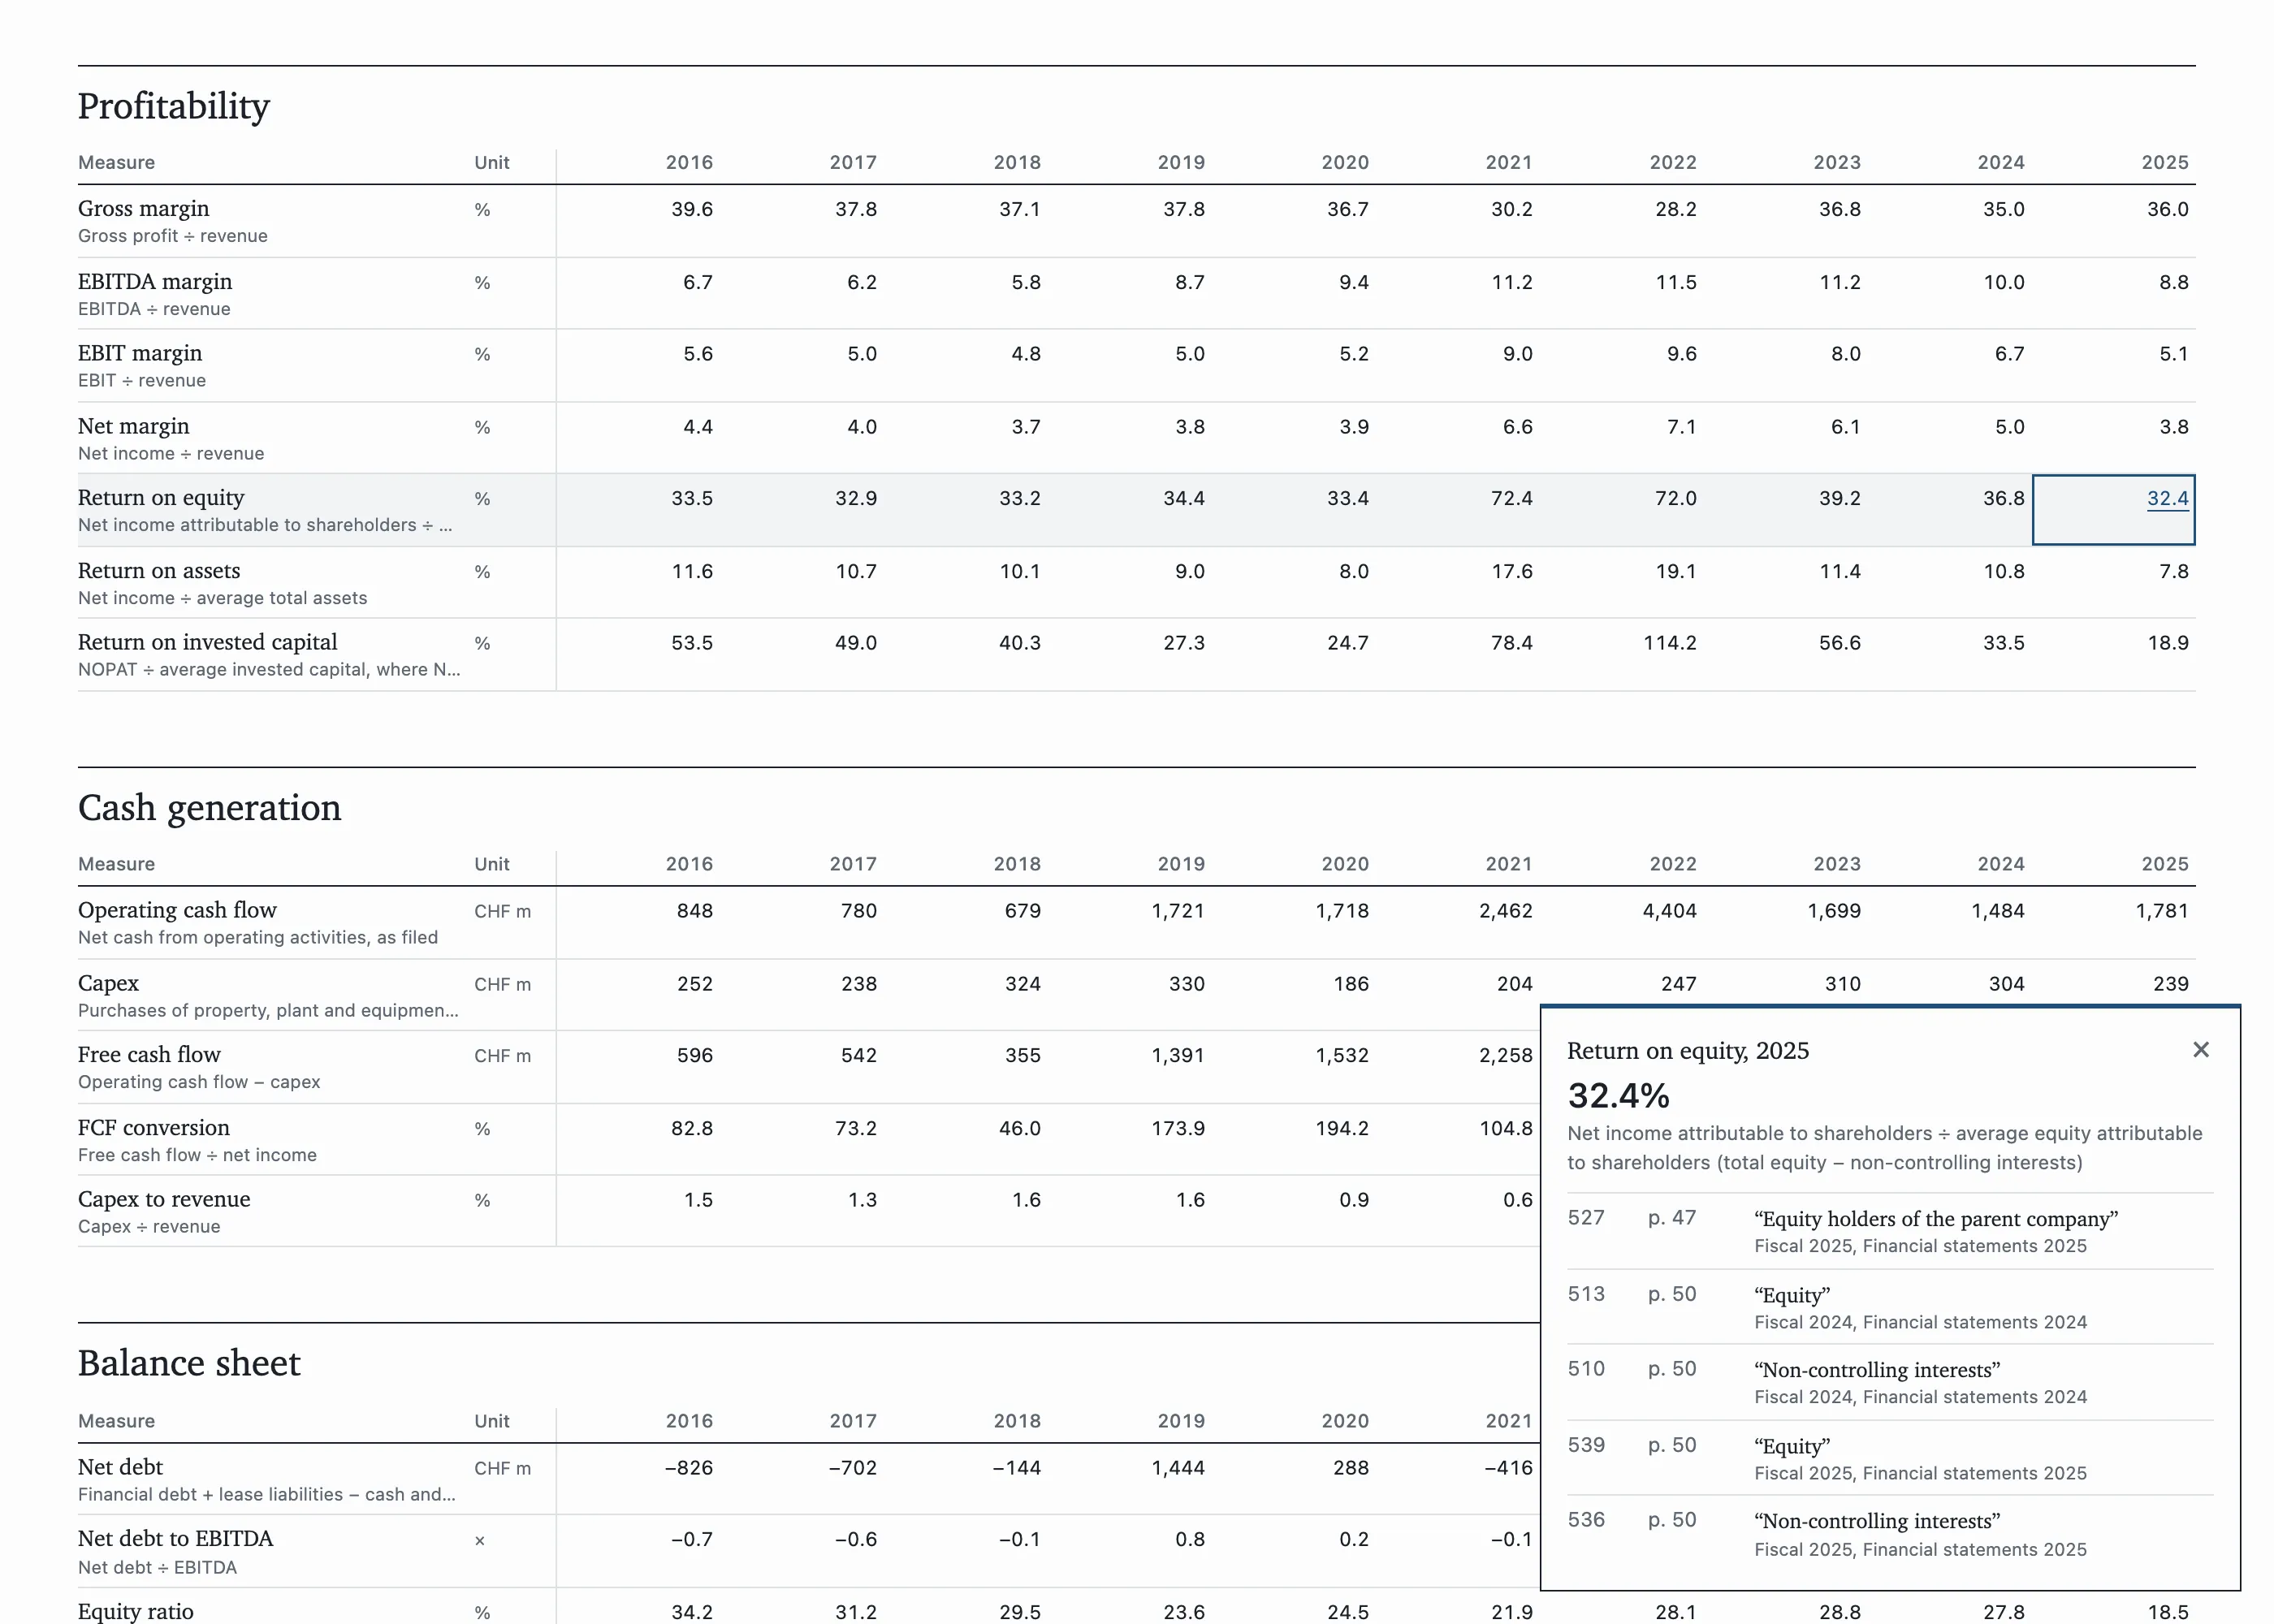
Selecting the 2025 return on equity. It came from five filed lines: net income attributable to shareholders on page 47 of the 2025 financial statements, and equity and non-controlling interests on page 50 of the 2024 and 2025 statements, because the return uses average equity.
The traced number
Every number after loading is a Traced value, and it is one of two things:
- A leaf, with an origin. Either it is filed, a line from a report, carrying the document, its SHA-256 hash, the printed page, the report’s label and the publication date. Or it is observed, a market fact like a closing price, with its source and date.
- A derived value: an operation (add, divide, average, growth rate and so on) and its inputs.
When a derived value is built, its operation is applied to its inputs again, and if the result differs the value is refused. So a number can’t disagree with its own trail. Each number also gets a content id, a hash of its value, unit and origin or inputs, so the same number with the same trail has the same id on any machine.
Values carry their units too. A money amount divided by a share count is a per-share amount, and adding a ratio to a money amount is refused. Money is an exact decimal with a currency, never a float.
The pipeline
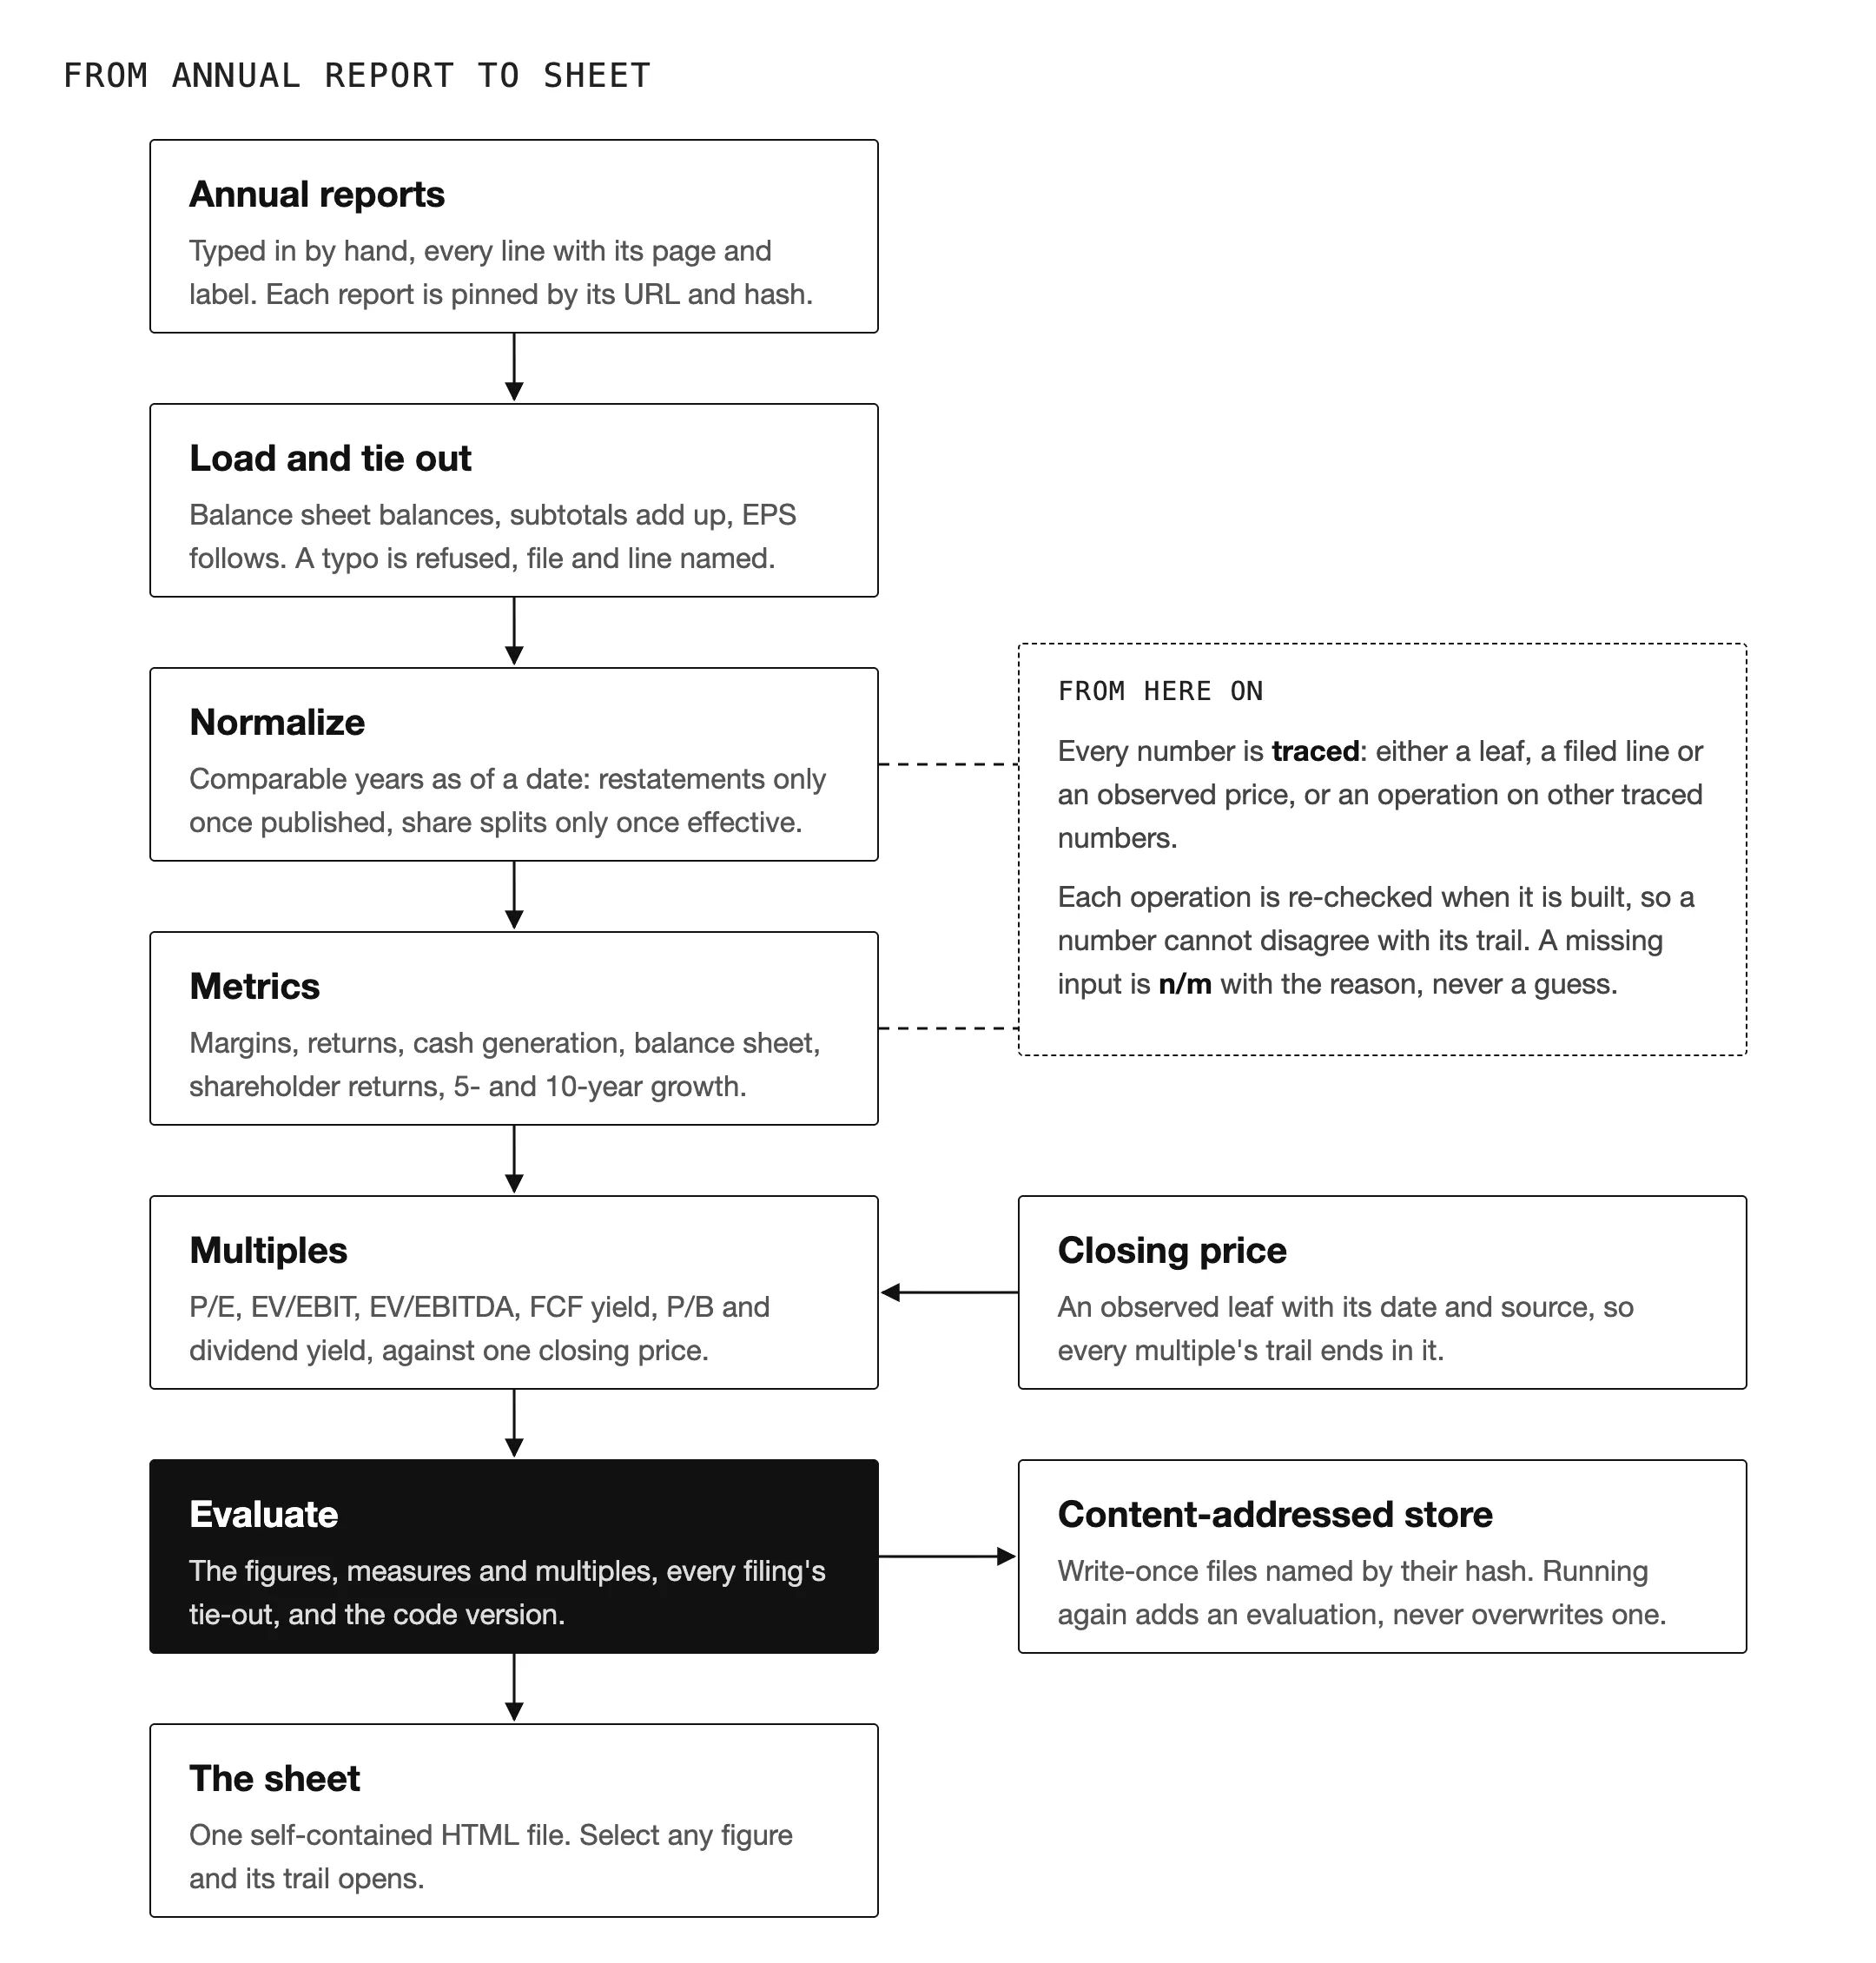
Each stage reads only what the previous one produced. Only the ends touch files: loading at the start, storage and the sheet at the end. Everything in between reads no files, no network and no clock.
- Load and tie out. Each company is a directory of TOML files, one per filing, with every line’s page and label. Each filing has to tie out before it’s used: assets equal liabilities plus equity, subtotals add up, and printed EPS follows from earnings and the share count. A typo in a total is refused at load time, with the file and line named.
- Normalize. Filings become comparable years, as of a date. A restated figure replaces the original only once the restating report was published, line by line. Share splits are applied only once they’re effective. Where one member of an accounting equation is missing, EBITDA say, it’s solved from the others, but a printed figure is never replaced.
- Metrics. A catalogue of standard measures, each defined once with its formula: margins, returns on equity, assets and invested capital, cash generation, balance-sheet ratios, shareholder returns, plus 5- and 10-year growth.
- Multiples. One closing price against the latest fiscal year: P/E, EV/EBIT, EV/EBITDA, FCF yield, P/B and dividend yield. The price is itself an observed leaf, so every multiple’s trail ends in the price, its date and its source as well as in the filings.
- Evaluate and store. The result is stored as write-once files named by their content hash. Running the company again adds a new evaluation beside the old one, never over it.
- Render one HTML file with the stylesheet and a small script inlined, so it fetches nothing. Without the script, a figure still links to its first source.
A few rules it keeps
Point in time. An evaluation as of a past date uses only what had been published by then, so you can see the company as it could have been read in 2015, without hindsight.
Nothing is imputed. A missing input, or a zero or negative denominator, shows as n/m with the reason, never as zero or a guess.
It describes, it doesn’t judge. The sheet has no thresholds, scores or verdicts, and it isn’t investment advice.
No vendor data in the repository. The figures are typed in by hand from public reports. Each report is recorded by its URL and hash rather than committed, so “page 47” always refers to one identified file.
It’s typed with mypy in strict mode and has over 300 tests, and CI runs the type checks, lint, formatting and tests on every pull request. Next on the roadmap: a second company, extracting figures from the report PDFs instead of typing them in, and comparing one evaluation with the next.
Revisions
| Rev | Date | Change |
|---|---|---|
| A | 2026-11-11 | First published. |